Samsung Web Marketing Metrics Analysis
A comprehensive study of Samsung's digital marketing performance (2019-2023), analyzing R&D investment impact, social media effectiveness, and competitive brand positioning using an interactive Excel dashboard.
Project Objectives
In the contemporary era dominated by digital technologies, every organization's expansion and financial success must gauge the efficacy of its marketing endeavours. This study evaluates Samsung's marketing effectiveness through key performance indicators.
- Examine Samsung's product performance and innovation
- Investigate Samsung's market trends over 5 years
- Assess Samsung's overall market performance vs competitors
Executive Summary
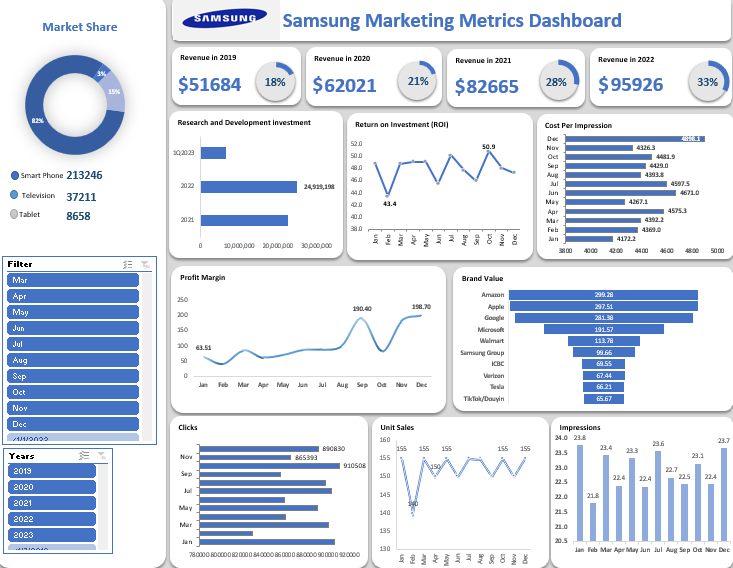
Through the dataset obtained from different sources, calculations, pivot tables, and charts were explored to create an interactive dashboard for Samsung.
The consistent investment in research and development from 2021 to Q1 2023 boosted the organization's return on investment by 34% and their profit margin by 19.5%. Effective investment in R&D has put Samsung in the top 5 of smartphone production, with 82% market share in the smartphone business.
Key Findings
Product Performance & Innovation
Consistent R&D investment resulted in 82% smartphone market share. Samsung ranks among the top 5 smartphone producers globally. Notable innovations include Galaxy Z Flip and Galaxy Fold.
Market Trends
Revenue increased from $51,684 (2019) to $95,926 (2022) — an 85% growth. Brand value increased by 12.1% compared to competitors like Apple, placing Samsung in the top 10 global brands for 2023.
Social Media Marketing Effectiveness
Strategic social media presence boosted engagement: +9% clicks, +4% impressions, and -2% cost per impression — demonstrating high campaign efficiency.
Competitive Position
Despite stiff competition from Apple, Samsung maneuvered through significant investment in R&D and social media marketing. Samsung smartphones dominated market share ahead of Xiaomi, Vivo, Apple, and Huawei.
Metrics Analyzed
Financial & Performance Metrics
- Market Share — Proportion of sales in smartphone, TV, and tablet markets
- ROI — Campaign effectiveness (revenue vs costs)
- R&D Investment — Research contribution to market positioning
- Brand Value — Market perception of brand strength
- Profit Margin — Revenue to profit efficiency
- Unit Sales — Device quantity for pricing optimization
Social Media Metrics
- Clicks — User interactions with Samsung ads
- Impressions — Ad display frequency on screens
- Cost Per Impression — Expenditure per 1,000 impressions
Strategic Recommendations
Tech Stack
Data Sources
- Samsung Official Website
- Site Checker Analytics
- Samsung Business Reports
- Statista Market Data
Key Results
- Revenue Growth +85%
- ROI Increase +34%
- Brand Value +12.1%
- Clicks +9%
- CPI Reduction -2%